How to use⚓︎
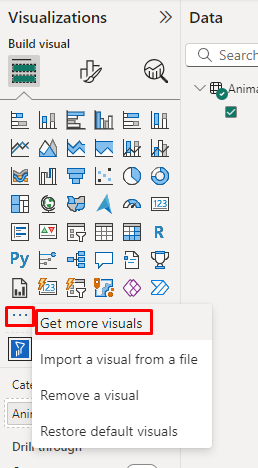
Before using you need to add the Filter by List custom visual to your report. First on the Visualizations Panel click on "..." and 'Get more visuals':
Seach for the visual and add it:
.png)
Once added click on it and drag the field you want to use to the Category Filter:
.png)
You can write the values individually:
.png)
Or copy and paste them for other sources:
.png)
If you click on the selection button, the visual will filter the report page to the values inserted:
.png)
You can also unselect the values, to filter out the values from the report page:
.png)
There can also undo the button selected and to the clear the filter.
You can copy and paste the Filter by List and also synchronize the visuals:
.png)